Lean Startup
The grim reality: most startups fail, and most new products do not succeed. Good technology and talented people alone do not guarantee success.
Startup success is not a matter of good genes, timing, or location. It comes from following the right process. That means it can be learned—and, put another way, taught. Eric Ries's The Lean Startup approaches experimentation and learning under uncertainty from this perspective.
Based on material I previously shared with the team, this article organizes The Lean Startup into three parts: Vision, Steer, and Accelerate. It begins with why we are doing the work, then moves through what to build and how to validate it, and finally considers how to achieve sustainable growth.
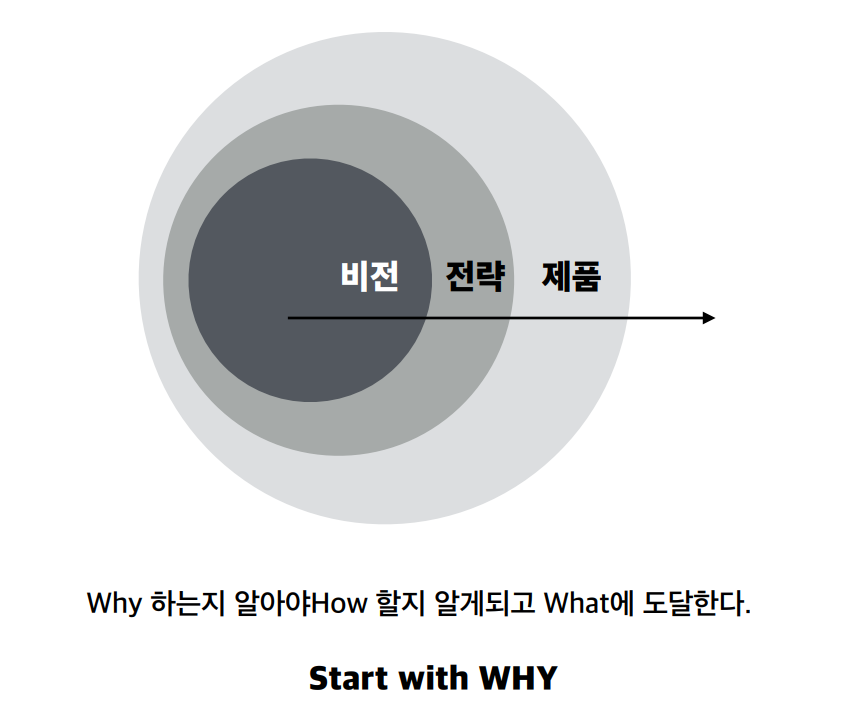
I. Vision
Defining a startup, getting started, experimenting, and learning
What Is a Startup?
A startup is an organization that creates a new product or service under conditions of extreme uncertainty. What matters in this definition is neither the company's size nor the year it was founded. A government agency, a new-business division inside a large corporation, and a small venture can all be startups if they face the same conditions.
Lean means removing excess. The Lean Startup is about organizations—and ways of working—that reduce waste and move quickly to build new products in uncertain environments.
Who Counts as a Startup—or an Entrepreneur?
SnapTax, one of the products discussed in the book, was designed to make filing taxes simple on a smartphone. It initially focused on customers in California with straightforward returns. Users photographed their W-2 forms, and the service read the necessary information and helped them file. After validating the need within this narrow scope, the team gradually expanded the service's audience.
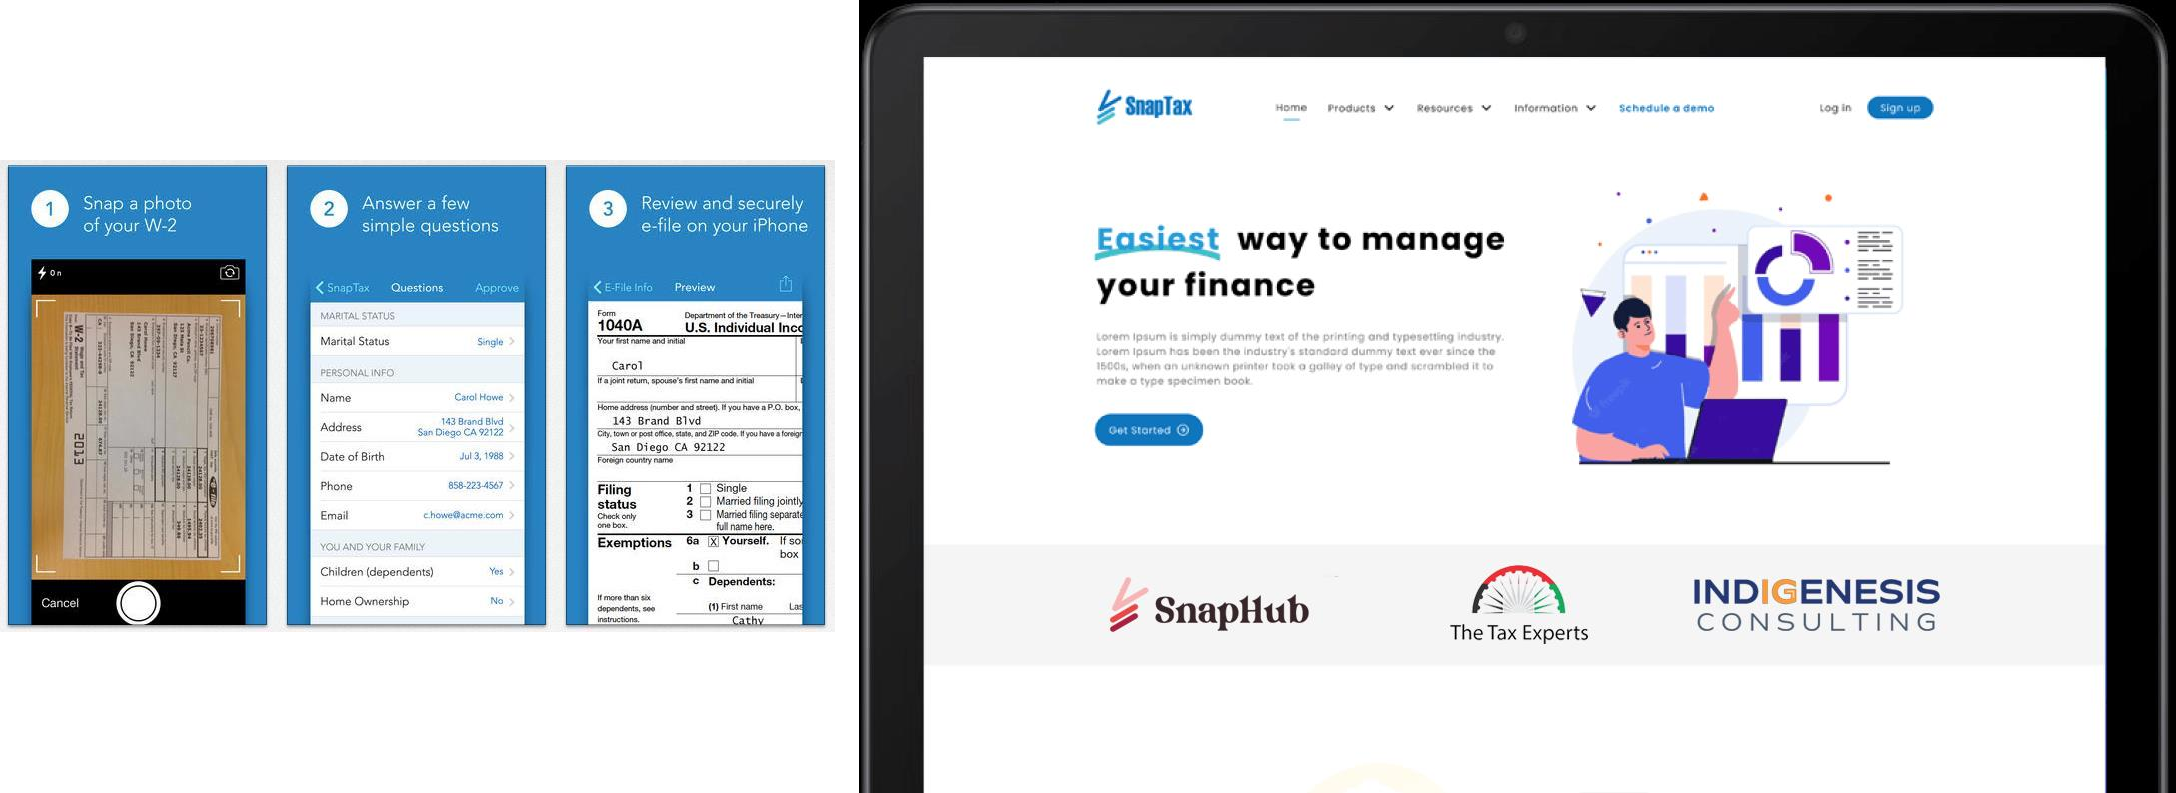
The product was built by Intuit, a tax and accounting software company. This was not an independent company founded in a small garage, but a five-person team inside a large organization. Intuit did not bring in a famous outside entrepreneur or assemble a huge organization from the outset.
What mattered was an environment that made experimentation possible. Management supported the team in meeting customers and testing the product, while the team explored new possibilities with limited resources. The defining condition of a startup lay less in which company it belonged to than in which problem it was solving and how it approached that problem.
Our Team Is a Startup, Too
By definition, our team is a startup, too. So what work should we do, and how should we do it?
Set the vision. Develop the product. Market and sell it. Reach more customers. Design the organization. Measure results. Make decisions. A startup's job is everything it takes for the service and the team to survive.
Yet simply building something is not enough, and neither can everything be planned in advance. A structure in which research, development, marketing, and operations each finish their specialized work and hand it to the next department makes it difficult to resolve uncertainty quickly.
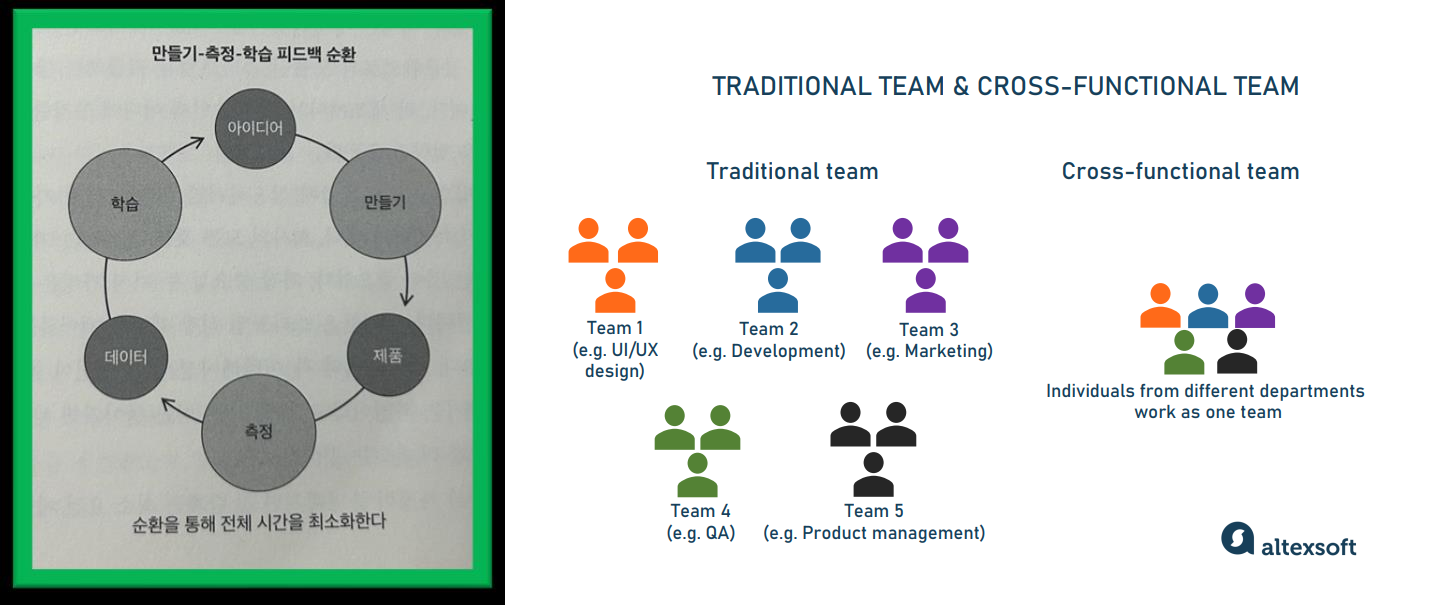
Work in cycles defined by learning milestones. Research → product development → marketing → operations and data measurement: one cycle is complete only when customer feedback has been incorporated. Avoid doing a large batch of work and handing it off to the next department. Work end to end, and collaborate. That is why we need a cross-functional team with different expertise and one shared goal.
Eight hours of coding without interruption: was that a productive day? A feature delivered on time and within budget: did the team move forward? Building a feature nobody wants, even on time and within budget, is waste. Raise productivity by building products and services customers want.
Experimentation and Learning: The Story of IMVU
IMVU, which Eric Ries helped build, created an avatar-based messaging service. At the time, the team believed it could spread the product quickly by leveraging the friend networks users had already established in existing messengers. Their assumption was that customers would find installing a new program and rebuilding a friend list too burdensome.
The team spent about six months developing compatibility with existing messengers. After launch, however, the expected response never arrived. They fixed bugs, added features, and managed metrics to show investors, but the product's value still failed to reach customers.

Meeting customers directly revealed a different story. The avatars were interesting, but people did not want to invite existing friends before they knew whether the product was cool enough. The team changed the flow so that people could try it alone, yet customers still did not invite their friends.
They did respond, however, to the ability to meet new people inside the product. What they wanted was the experience of making new friends, rather than talking with people they already knew. Installing another program and creating a separate friend list were not the major barriers the team had expected.
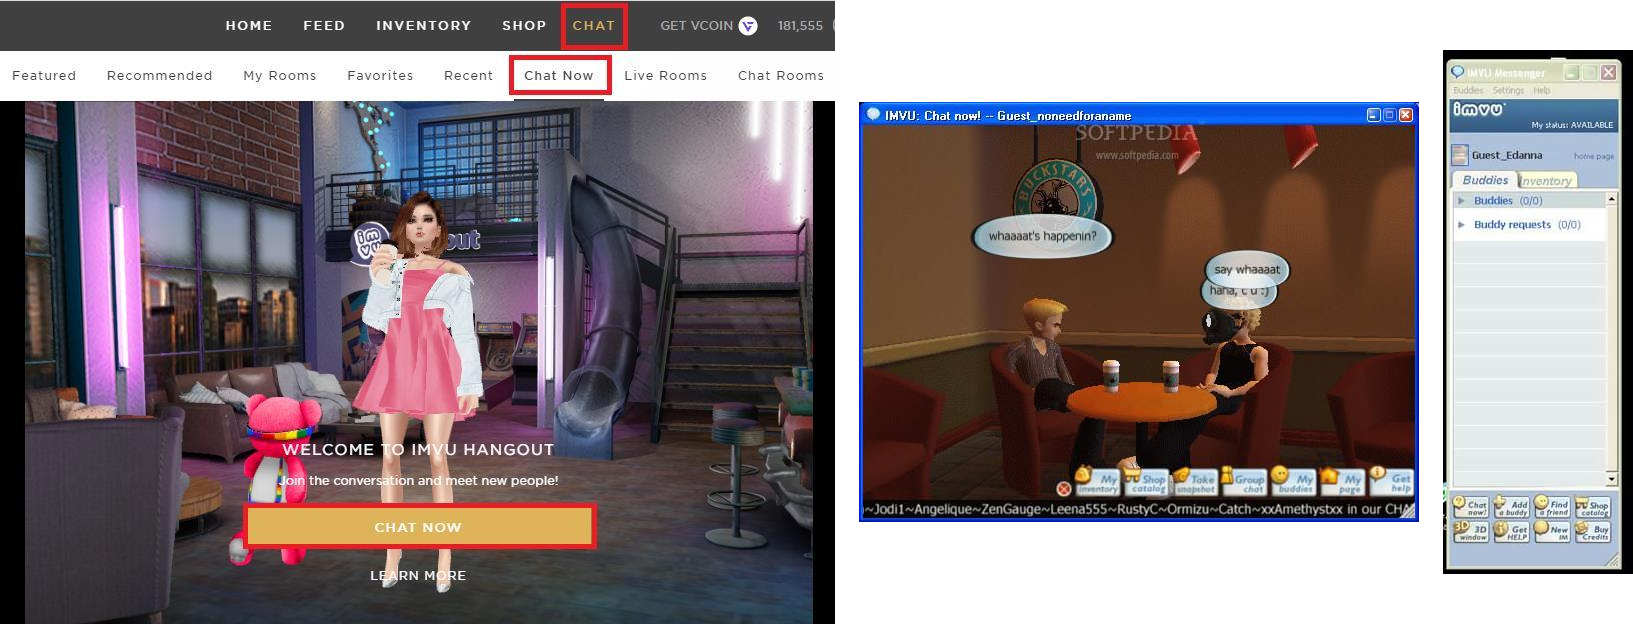
In hindsight, there was no need to integrate with ten messengers. One would have been enough to test the core assumption. If the goal was to gain insight into customers, could we have learned this before spending so much time? Yes!
II. Steer
Assumptions, testing, measurement, and pivots
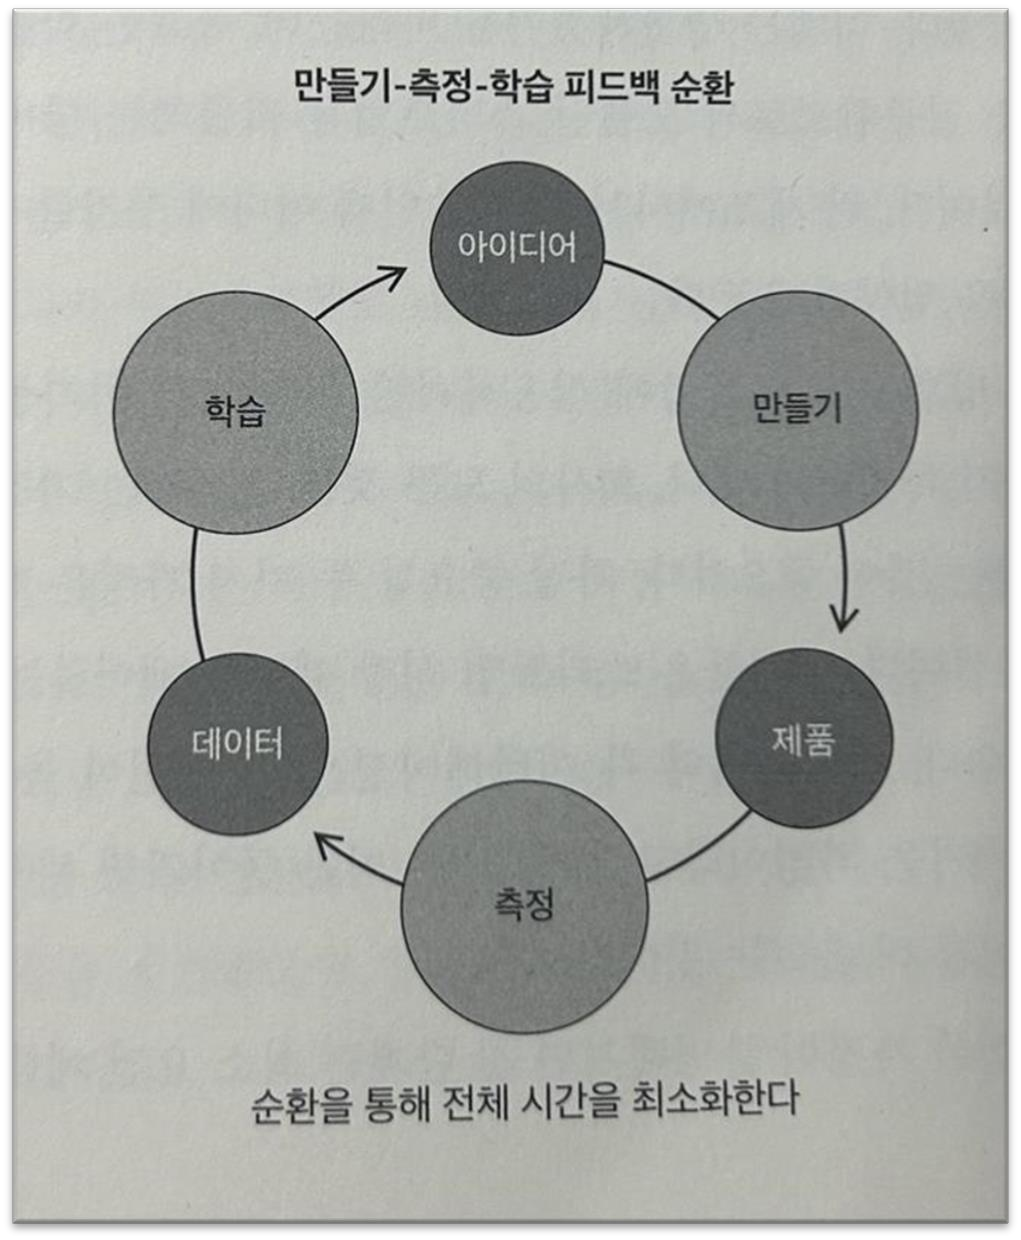
Remember this: a startup is experimentation and learning. It is the process of systematically discovering what we should build. Assume → build (test) → measure → persevere or pivot. Minimize the time through the entire loop.
The Two Riskiest Assumptions
Value hypothesis: does our service or feature have value for customers? Growth hypothesis: can our service grow enough to sustain itself? These are the first two questions to answer before building the product.
Scaling a product before answering these questions only piles more time and resources onto unvalidated assumptions.
MVP: Minimum Viable Product
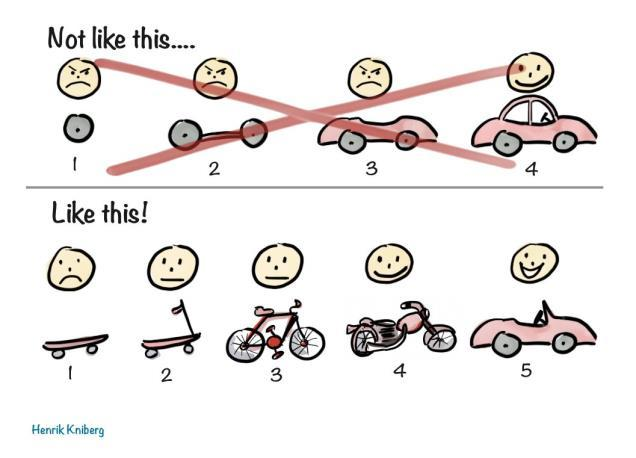
An MVP is not built merely to answer product-design or technical questions. It exists to test the business's core assumptions. With the least possible effort and time, it must let the team complete one full build–measure–learn cycle.
What to include and what to leave out therefore depend on the assumption being tested. A product is not an MVP simply because it has few features. It must be complete enough to reveal whether customers perceive value and how they behave.
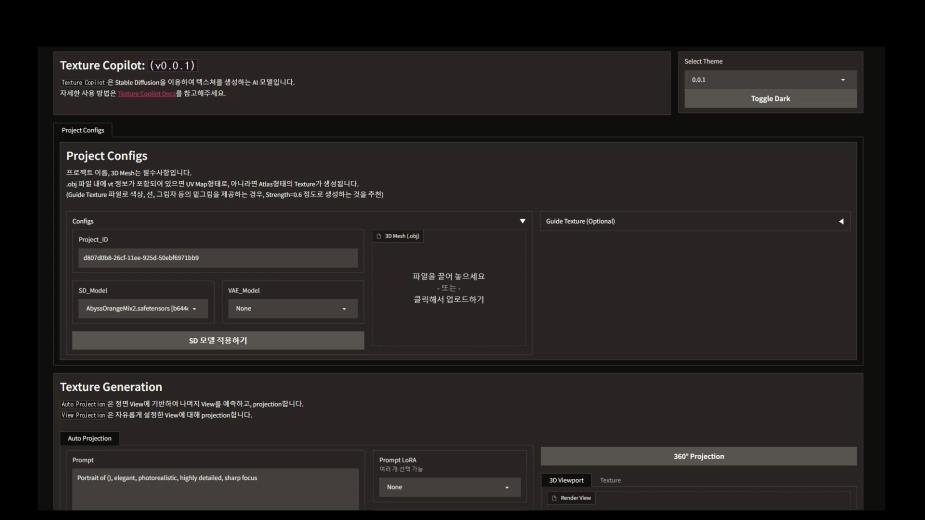
In an early VARCO Texture experiment, we built an MVP with Gradio in about a week. We wanted to learn whether artists found value in AI texture generation. Their feedback was that they would want to use it if the results improved, but the quality was not yet sufficient and the UI and UX were inconvenient. At the time, we decided to keep developing the product based on that response.
Measurement: Vanity Metrics and Actionable Metrics
Once an MVP has produced data about the current product, the team uses that data to adjust the product and test again. Repeating this process informs the decision to persevere or pivot.
Numbers that inevitably rise over time, such as cumulative sign-ups, make it difficult to tell whether the product has actually improved. The material explained this as the difference between vanity metrics and actionable metrics. Actionable metrics help determine how a specific change altered customer behavior.

What if vanity metrics stay flat, but cohorts arriving after a feature update show higher payment conversion or referral rates? That is improvement. And if they do not, why not? Learn through customer interviews and observation. Improve the product using what you learn. That is validated learning.
Thinking Through the CAPA Example
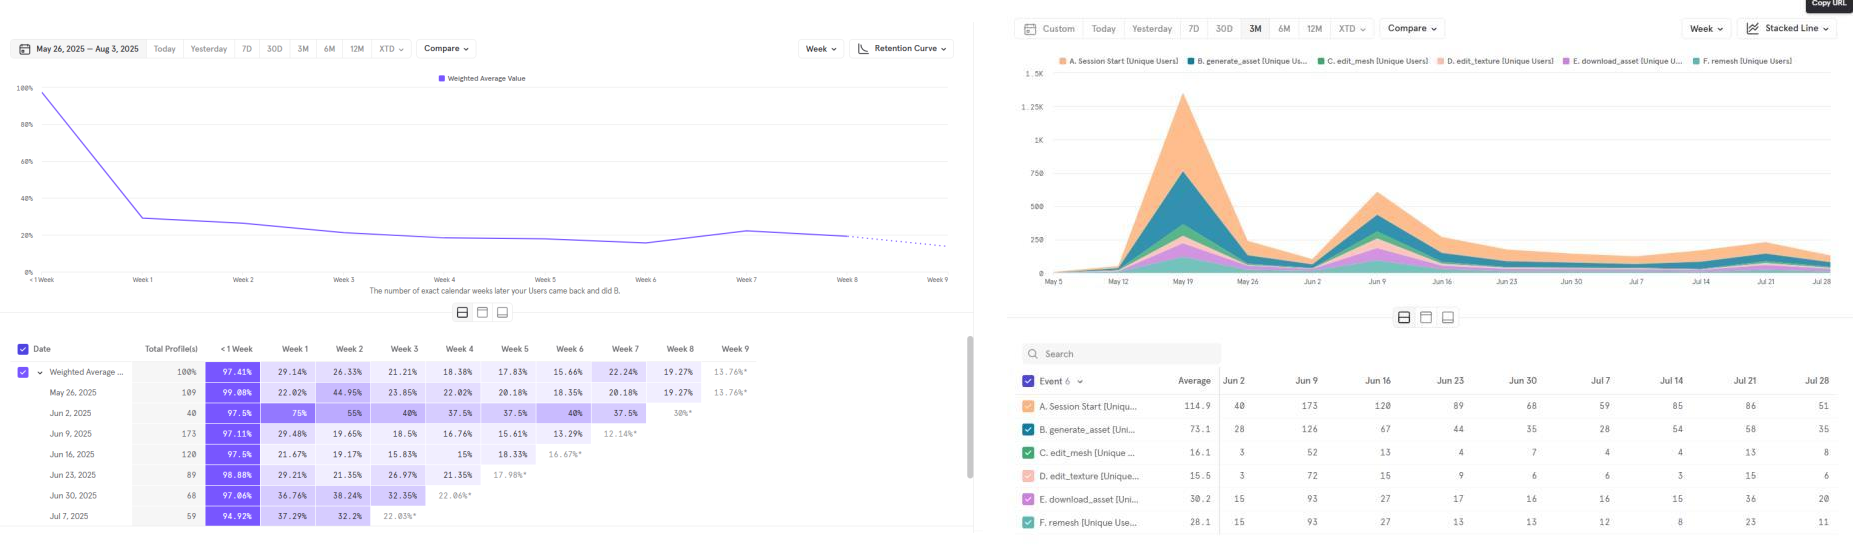
The material posed questions based on CAPA's return rate and feature-usage data after its internal launch. If the return rate settled in the twenty-percent range from the second week onward, how should we interpret it? We would need to see whether the same pattern continued after the public launch. The payment conversion rate we expected at the time was also a hypothesis to validate once a payment module had been introduced.
As an example, we looked at a feature-usage mix of 70 percent for 3D generation, 10 percent for editing, and 20 percent for Remesh. Was editing used less because it did not work well, or because customers had little need for it? Numbers are the starting point for questions, but they do not explain the reasons by themselves.
Will the feature we are building right now increase payment conversion? What would make customers share a link with the people around them? Our questions and decisions should be grounded in metrics—in data. Of course, that is often difficult in the early days.
Pivot or Persevere
If repeated experiments still fail to produce sufficient revenue, conversion, or retention, the service or business may need to change direction. Like the basketball move in which a player keeps one foot planted while turning, a pivot changes a core assumption while preserving an important foundation. It is distinct from repeatedly adding features or making minor UX improvements.
The material offered three hypothetical examples: changing the target customer for the same product from indie game developers to large game studios; moving from credit-based subscriptions to usage-based API pricing; and expanding from 3D modeling into a game-development solution that also includes sound. Each rethinks a different dimension: customer segment, pricing model, or product scope.
These decisions need metrics—data. Understand that the need to pivot will keep coming up in business. What matters is the evidence: do we have a reason to keep our current assumptions, and which assumption needs to change?
VARCO 3D's Core Metrics
An early draft of VARCO 3D's metrics used revenue as the headline measure, alongside subscription conversion and retention, and user return visits. In the beginning, the aim was not only to attract many customers, but also to focus on whether those who arrived experienced the product's value and stayed.
The initial customer focus was AI creators and indie game developers. We then considered expanding to 3D modelers and game-art professionals, larger production organizations, and other industries. The sequence was to validate value within a narrow customer segment before moving into the next market.

Assume → build → measure → persevere or pivot.Always ask: can the feature or improvement I am working on right now raise revenue, subscription conversion, retention, or referrals?
III. Accelerate
Growth, adaptation, and innovation
What matters in a startup is the validated learning needed to sustain a business. Which service do customers really want? How will the business grow? Who is the customer? Which customers should we listen to, and which can we ignore?
KPIs: What Should We Focus On?
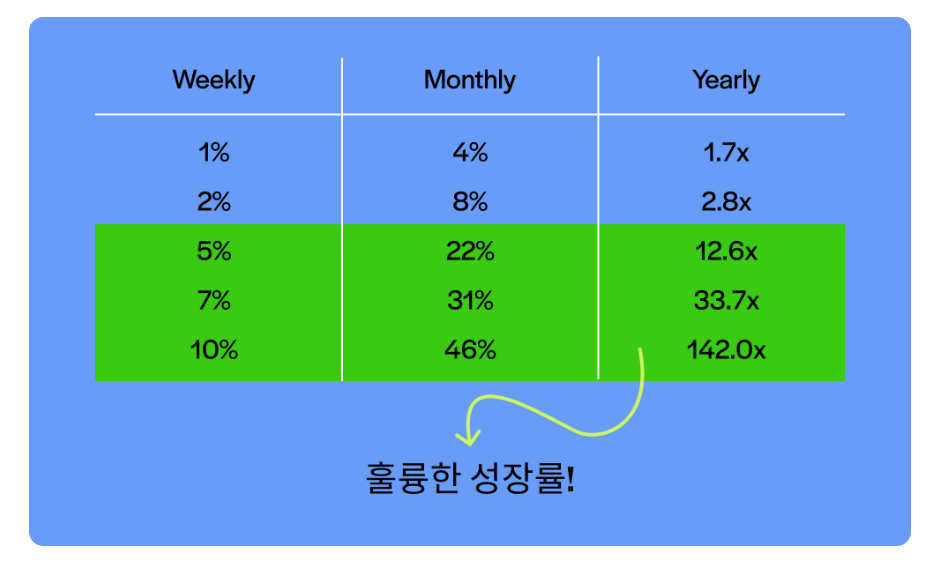
KPIs make today's work concrete. Numbers do not lie. Shipping a product and receiving positive external reviews do not by themselves prove that it creates customer value. We need a headline metric that represents the service's actual value, along with supporting metrics that explain why it moves.
Depending on the business model, the headline metric might be revenue or number of users. A small set of supporting metrics—such as return rate, revenue churn, customer acquisition cost, and referral rate—should reflect the business's current stage. Rather than giving every number equal weight, the team focuses on the measures connected to its present goal.
Checking growth goals at a regular cadence makes this week's work clearer. The team can define the customer behavior required to reach the goal and plan experiments designed to change it.
The Three Engines of Growth
The book describes three engines through which growth can occur.
In the sticky engine of growth, the key is keeping customers over time. The relationship between incoming and departing customers must be considered together, with close attention paid to cancellations and churn.
In the viral engine of growth, using the product itself becomes a channel through which other customers discover it. Payment links and content sharing are examples of designing usage to create distribution. What matters is how many new customers each existing customer brings in.
In the paid engine of growth, the cost of acquiring a customer is compared with the value earned from that customer. The structure must make it possible to cover acquisition costs and reinvest in bringing in more customers.
A product can use several engines at once. But clearly identifying which engine will drive growth helps the team focus on improving the elements that engine needs in order to work.
A Structure That Enables Innovation
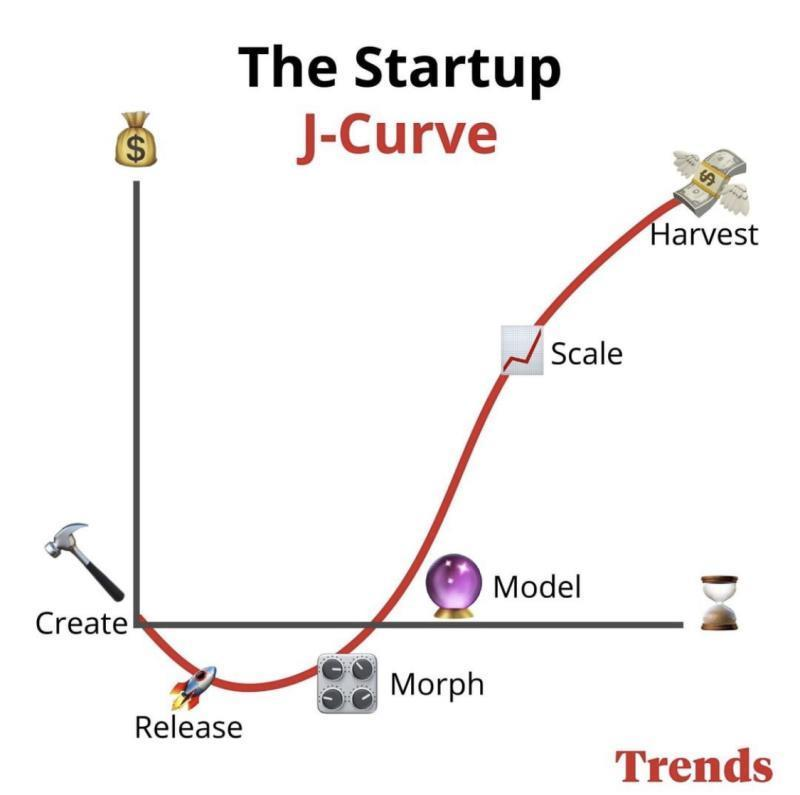
An internal startup team needs a structure that lets it continue experimenting. Management support should be used to create that structure. The material summarized three conditions.
First, scarce but secure resources. Too many resources can be dangerous, and so can too few. Even when a team begins with limited resources, it needs the stability of knowing that its budget will not suddenly change in the middle of an experiment.
Second, independent development authority. The team must be able to design and run experiments. Excessive approvals and handoffs must not slow the build–measure–learn cycle.
Third, a personal stake in the outcome. Contributors should be able to share in the results. This can include recognition and reputation as well as financial rewards.
These conditions do not guarantee success. They do, however, provide a foundation that allows a team building a new product to keep moving amid uncertainty.
Comments —